

A entity relationship or class diagram can be used to resolve the problem when stakeholders are interchangeably using different words to mean the same thing.
For the purposes of this article a conceptual model of a class diagram has been used. A conceptual model is at class level. A class is a group of data with similar characteristics. The different characteristics are known as attributes.
Writing down each type of data mentioned and drawing out the relationships between them will help understand the data and agree common definitions.
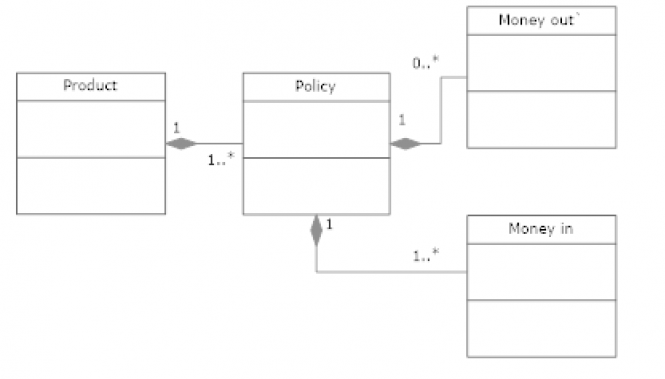
Taking the example in the diagram identifies 4 classes.
These are:
- Product
- Policy
- Money out
- Money in
Other terms for money out could have been movements, claims, transactions, payments and so on. Writing out all of the words used and then agreeing which term to use will help prevent duplication and misunderstandings. This is particularly useful for specialised areas where a lot of jargon may be used.
Drawing out the relationships between the classes will provide an understanding of whether the data is at class or attribute level. If the relationships drawn out are one to one then they may be part of one class so will be attributes, if there is a one to many relationship then they are separate classes.
In the diagram the following can be ascertained by the relationships shown:
- a product can belong to one to many policies however a policy can only contain one product
- a policy may have zero to many instances of money going out however a money out instance will only relate to one policy
- a policy may have one to many instances of money going in however an instance of money in will only relate to one policy
This type of diagram can be put together fairly quickly in a workshop and provide a lot of information about the data required.
Thoughts? Questions? Please share in the comments.